Exploring Uber/Lyft pickups and dropoffs in San Francisco
I was working with the San Francisco County Transportation Authority on some other data visualization tasks when they asked me if the platform we were building could help them explore a new dataset they had stealthily acquired on ridesharing trips…
For the full blog entry on this topic, check out my Medium post.
The SFCTA is at the forefront of research on the impact “ridesharing” services such as Uber and Lyftare having on our most congested cities. These services, referred to as “Transportation Network Companies” or TNC’s by urban planners, often don’t share much data with public agencies. The following data was an exciting first.
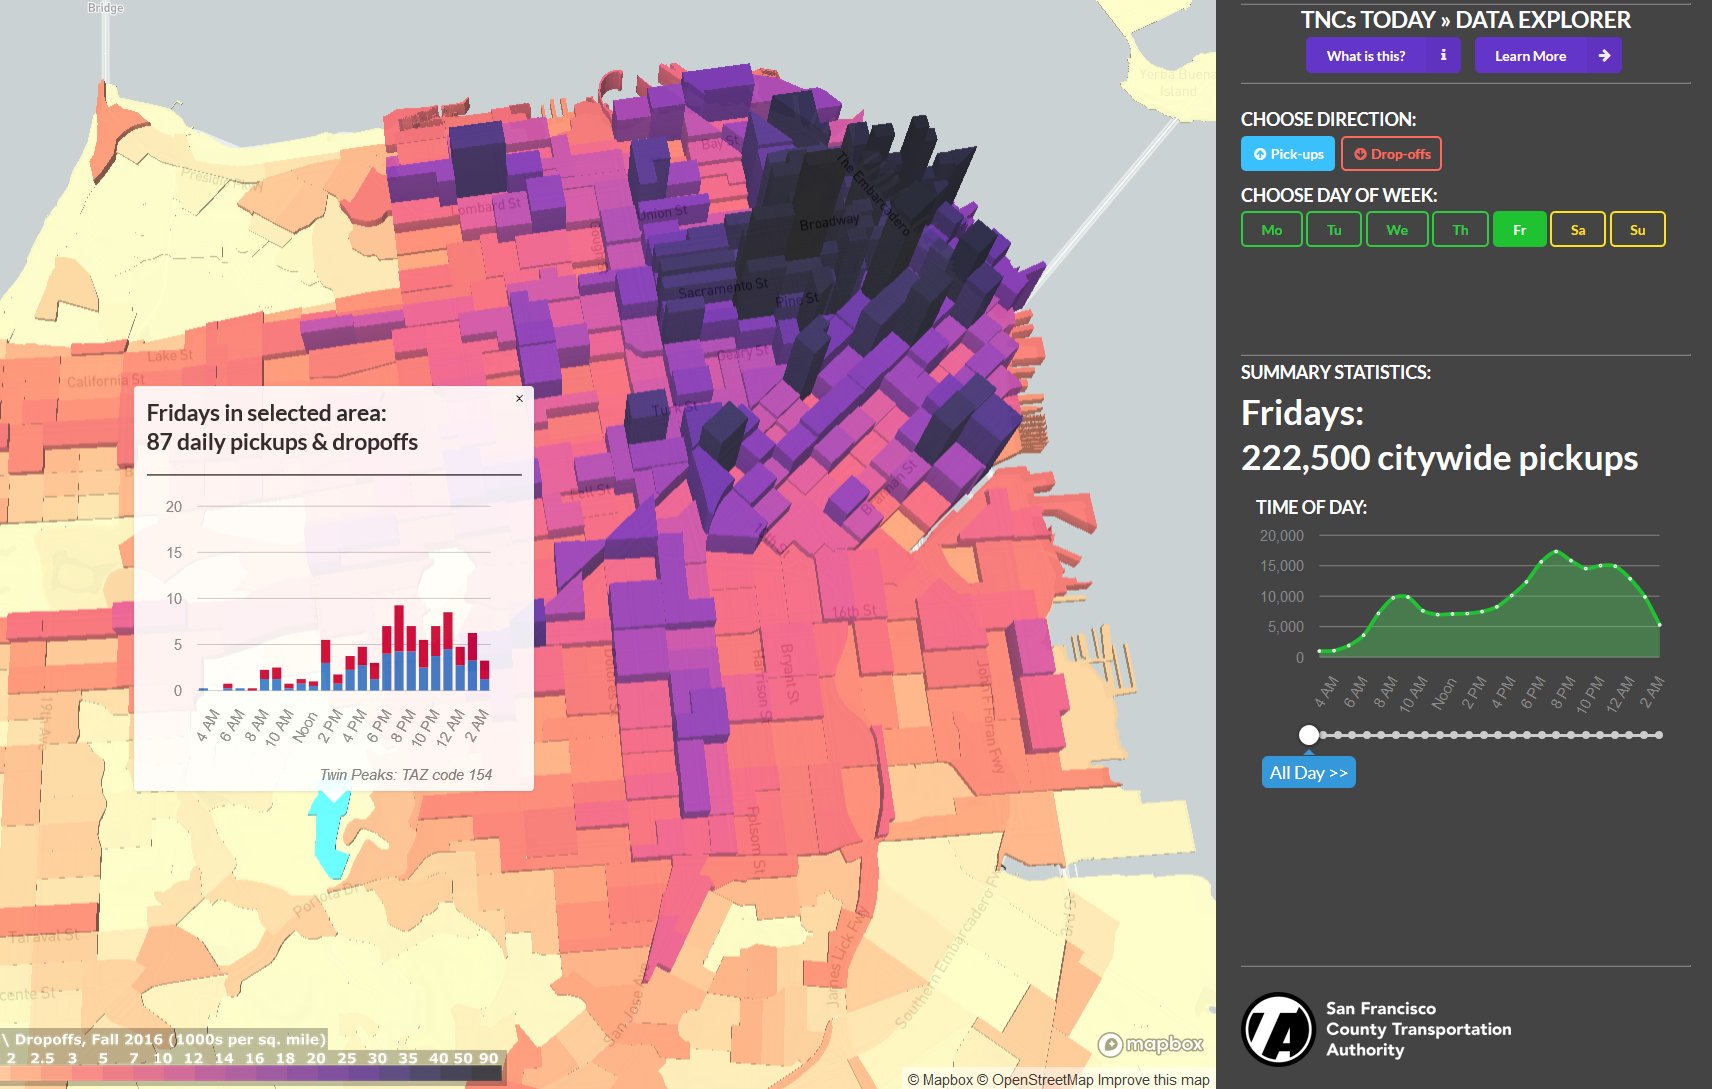
The “TNCs Today” data explorer
Click to explore more than 200,000 daily TNC (Uber and Lyft) trips in San Francisco:
There is a lot to play with:
- Try out the 2D and 3D views: 3D really shows the striking patterns of TNC activity in the city across different days of the week, while the 2D view makes it a bit easier to click and explore individual locations.
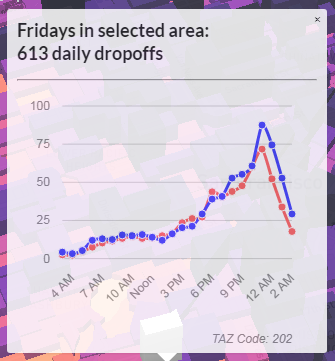
- Clicking on any block on the map will pop up a daily graph of pickups and dropoffs for that area. You can then switch to different days of the week to see how Mondays differ from Fridays, for example.
- You can select views by day of week, and you can explore either all-day totals or focus on trips during a specific hour.
Notable nuggets in the data
-
Trips in Ubers and Lyfts go up and up as the week progresses.
-
Fridays have the most daily trips on average. You can easily see the commute “humps” during the AM and PM rush hours — when traffic is already at its worst. You can also see a lot of evening and late-night trips, which aren’t as prevalent mid-week.
-
Weekdays have a predictable commute pattern with two peaks in the AM and PM rush. Fridays and Saturdays have much more evening travel than other days do, extending very late into the nighttime
-
Uber and Lyft trips are far more frequent in the northeast quadrant of the city, basically north of Cesar Chavez and east of Divisadero, on all days and at all times of day
- Notable tourist attractions such as Fisherman’s Wharf, the Golden Gate Bridge, and GG Park museums are easily visible, and have very different time-of-day distributions than downtown
-
Weekend hotspots show up on Friday and Saturday nights: the Castro, Mission/Valencia, North Beach, the ballpark, and many others
- Lots of late-night trips to and from the Castro on Friday nights: 🍸🍸
Leveraging open source in the public sector
We had already settled on a fully open-source stack of technologies as a base for the agency’s upcoming data visualization efforts. These were more than just “free tools” — the combination of these components resulted in something far more flexible, and just as powerful, as any off-the-shelf product I could have envisioned.
-
The back-end database is PostgreSQL with PostGIS spatial extensions. The PostGIS extension allows us to do cool stuff like geocoding, spatial buffers, paths, and offsets. PostGIS is awesome.
-
The Javascript front-end uses Vue.js for templating and reactive elements; what a pleasure learning and using this framework, and Mapbox GL for the interactive 2D/3D map.
Have fun playing around with the tool! I’m proud of this one.